Instead of focusing mainly on business performance or company fundamentals, technical analysis focuses on market behavior.
Some of the main areas include:
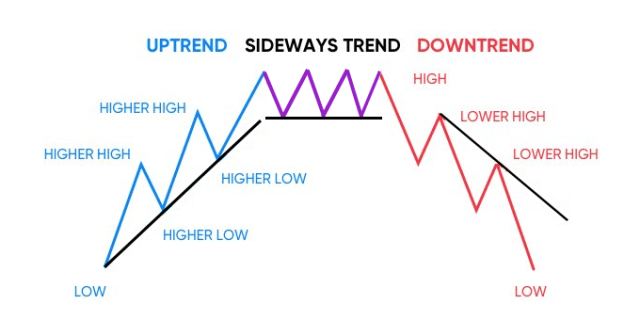
Price action refers to how price moves on the chart.
This includes:
Many experienced traders rely heavily on price action because it reflects real-time buying and selling activity.
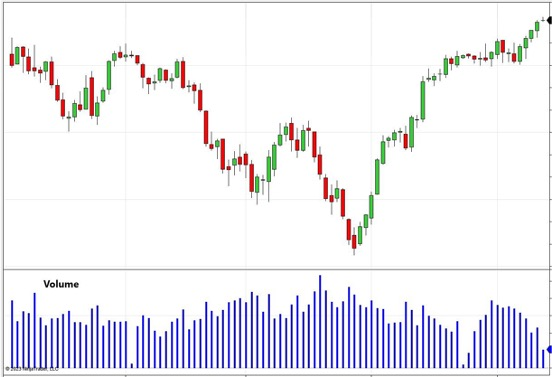
Volume measures how much trading activity is happening during a specific period.
High volume usually means stronger participation, increased market interest, and more conviction behind a move.
Low volume may indicate weak momentum, uncertainty, and lower market participation
For example:
If Bitcoin breaks above resistance with strong volume, traders may view the breakout as more reliable compared to a breakout with weak volume.
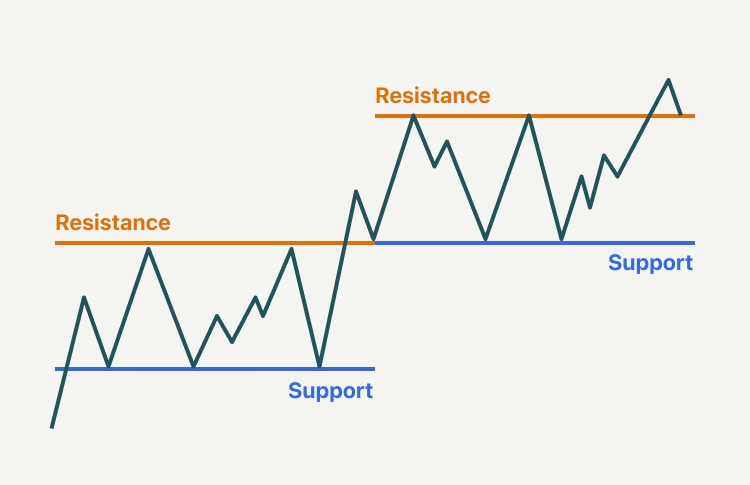
Support and resistance are key price levels traders watch closely.
Support is an area where buying pressure may become strong enough to prevent price from falling further.
Resistance is an area where selling pressure may become strong enough to prevent price from moving higher.
These levels matter because traders often:
Support and resistance levels are some of the most fundamental concepts in technical analysis.
Momentum measures the strength of a market move.
Strong momentum usually means price is moving aggressively in one direction. Weak momentum may indicate that a trend is slowing down.
Indicators like the Relative Strength Index (RSI) help traders analyze momentum.
Technical analysis is especially popular in cryptocurrency markets because crypto trades 24/7 and is heavily driven by speculation and market sentiment.
Unlike traditional stock markets that close during weekends or holidays, crypto markets remain active at all times. This creates constant price movement and volatility.
Because crypto can move very quickly, technical analysis helps traders create structure and reduce emotional decision-making.
However, beginners should understand that crypto markets are also highly volatile. Sudden news, liquidations, macroeconomic events, or whale activity can cause large price swings even when charts appear technically strong.
This is why risk management is extremely important.


