Technical analysis uses charts, indicators, and market structure to help traders better understand price movement. While there are many advanced tools available, beginners should focus first on learning a few core concepts instead of trying to master everything immediately. Some of the most commonly used tools in technical analysis include candlestick charts, moving averages, the Relative Strength Index (RSI), and trendlines.
One of the most important tools in trading is the candlestick chart. Candlestick charts visually show how price moved during a specific timeframe. Each candlestick contains four important pieces of information:
Traders use these candles to understand market momentum and buyer or seller behavior.
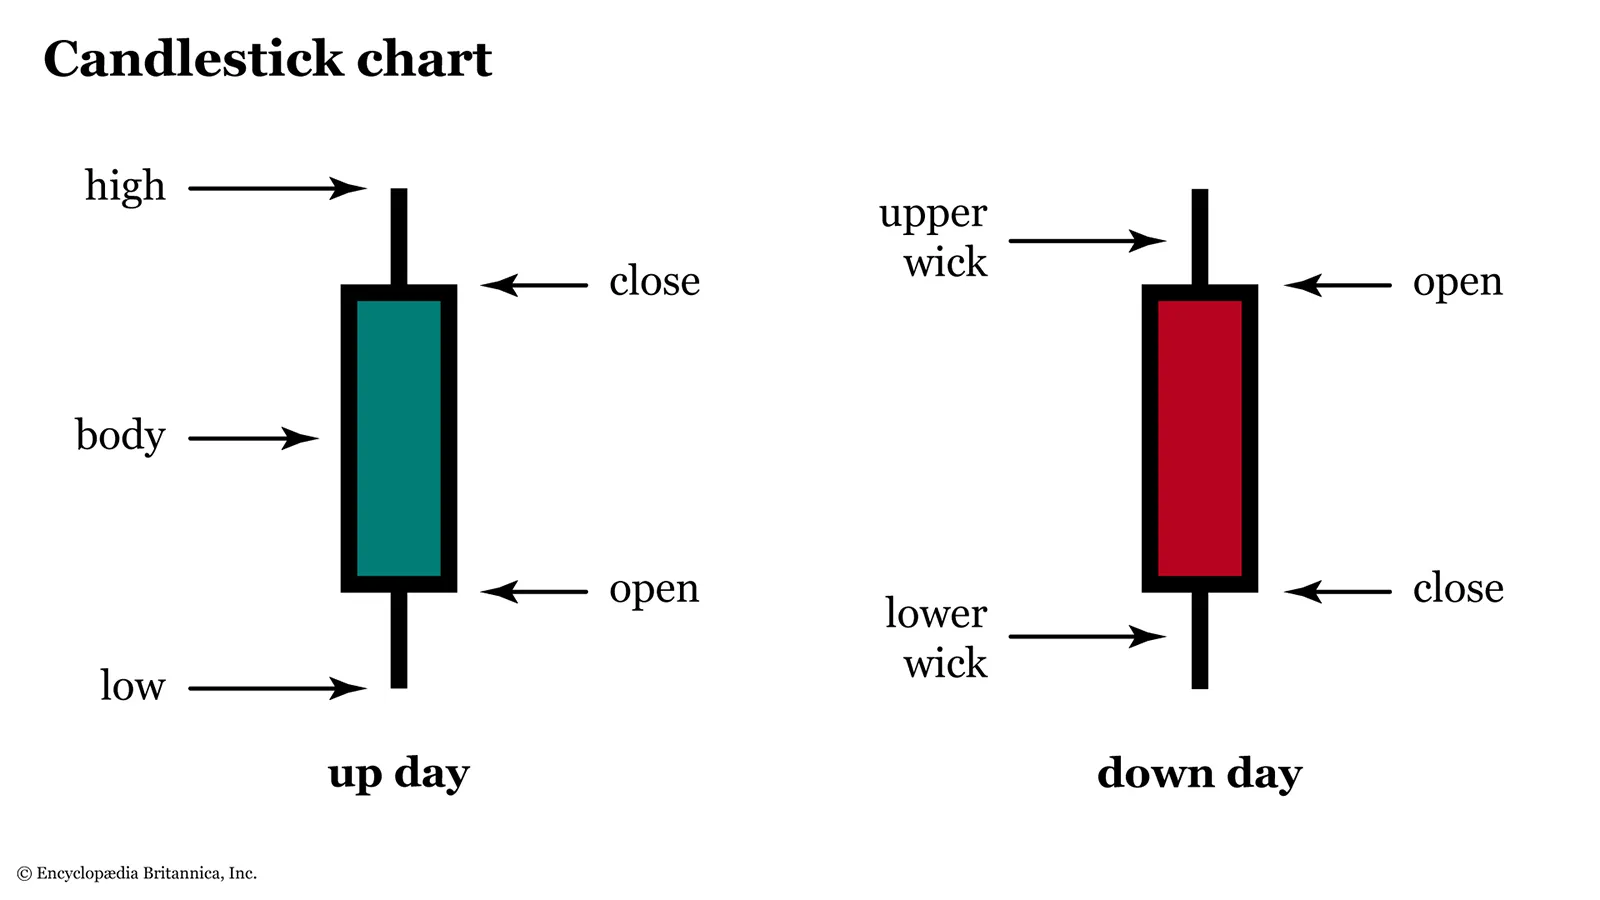
A green candle usually means the closing price is higher than the opening price, which may indicate buying pressure. A red candle usually means the closing price is lower than the opening price, which may indicate selling pressure.
Candlestick charts can be viewed on different timeframes such as:
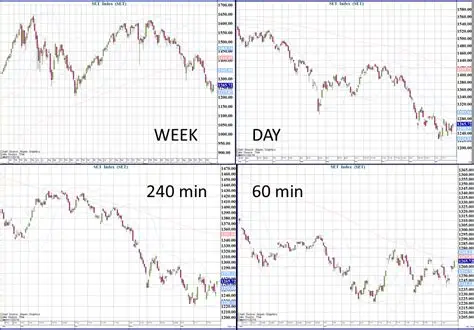
Lower timeframes move faster and are often more volatile, while higher timeframes usually show stronger and more reliable trends.
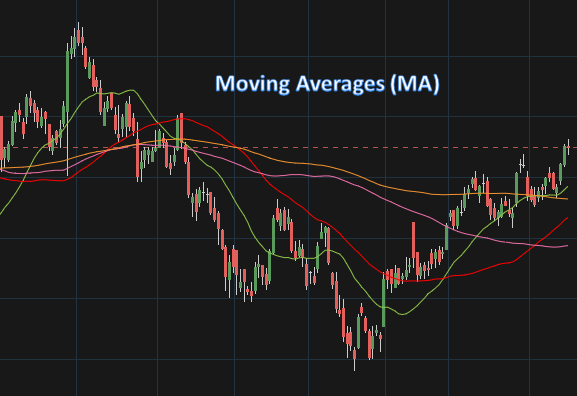
Another common tool used in technical analysis is the moving average. Moving averages help smooth out price movement by calculating the average price over a certain period of time. Traders often use moving averages to:
For example, if the price is consistently above a moving average, traders may interpret the market as bullish.
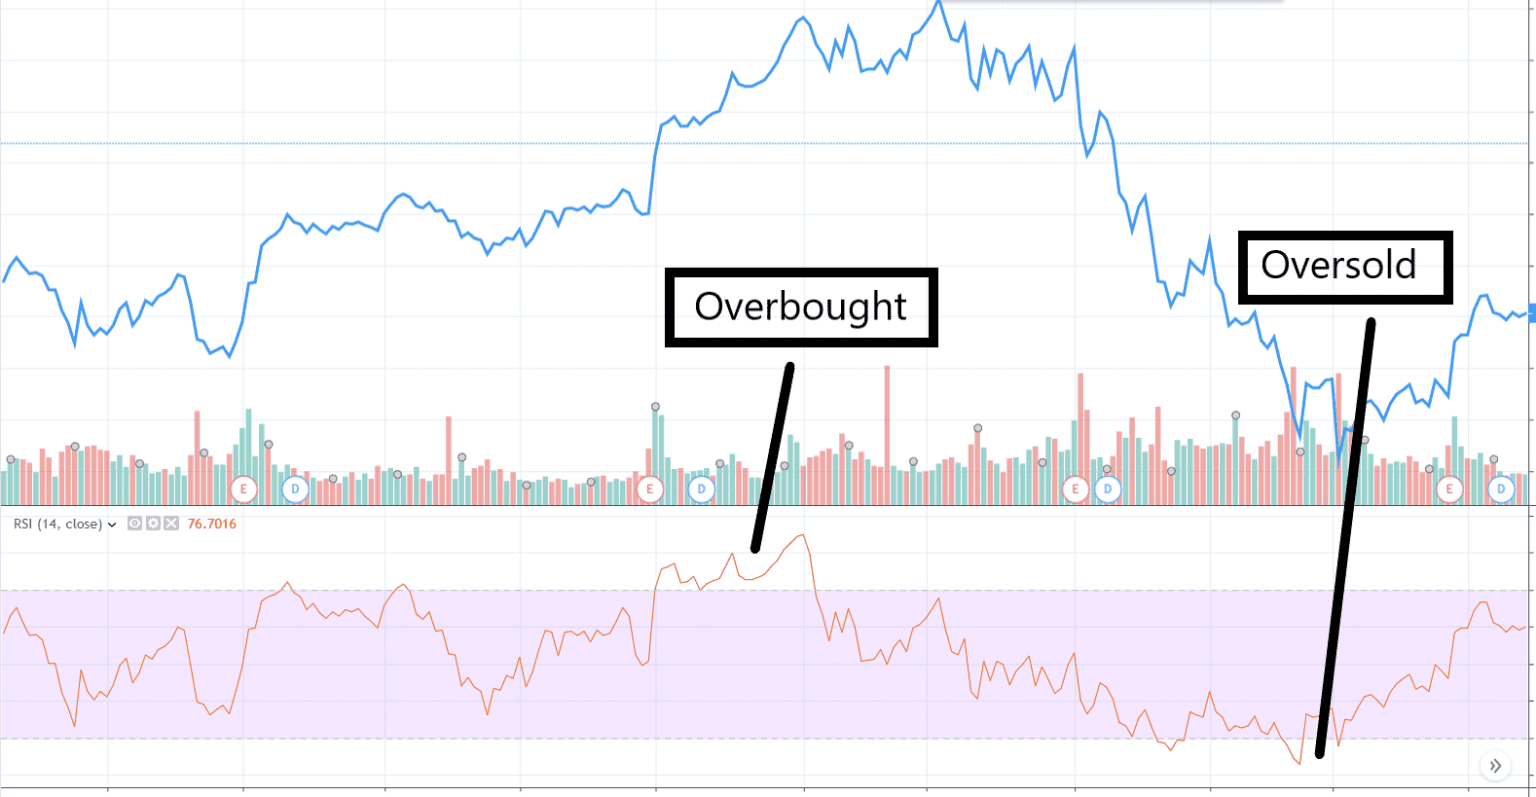
The Relative Strength Index, commonly known as RSI, is another popular indicator among traders. RSI measures momentum and helps determine whether an asset may be overbought or oversold.
Generally:
However, RSI should not be used alone as a buy or sell signal. Strong trends can sometimes remain overbought or oversold for long periods of time.
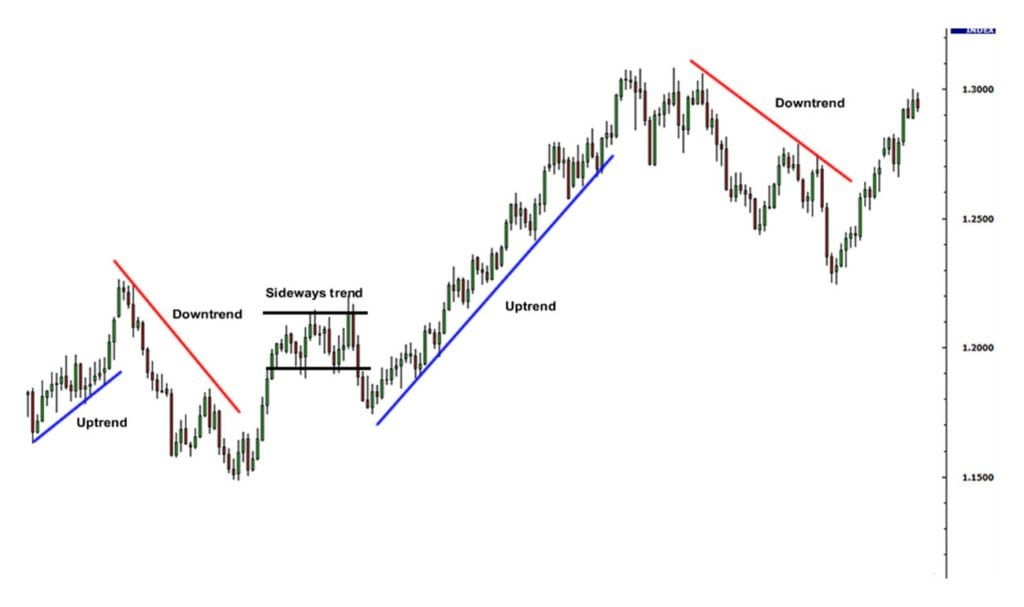
Trendlines are also widely used in technical analysis. Traders draw trendlines on charts to visualize the direction of the market and identify areas where price may react. Trendlines are commonly used to identify:
Although these tools can help traders make more informed decisions, technical analysis still has limitations. Markets are influenced by many factors including:
Because of this, technical analysis should not be treated as a guaranteed prediction tool. Instead, it should be viewed as a framework that helps traders improve probability and manage risk more effectively.
In trading, long-term success often depends more on controlling losses properly than predicting every market move correctly.


